 Tendrl
Dashboards Overview
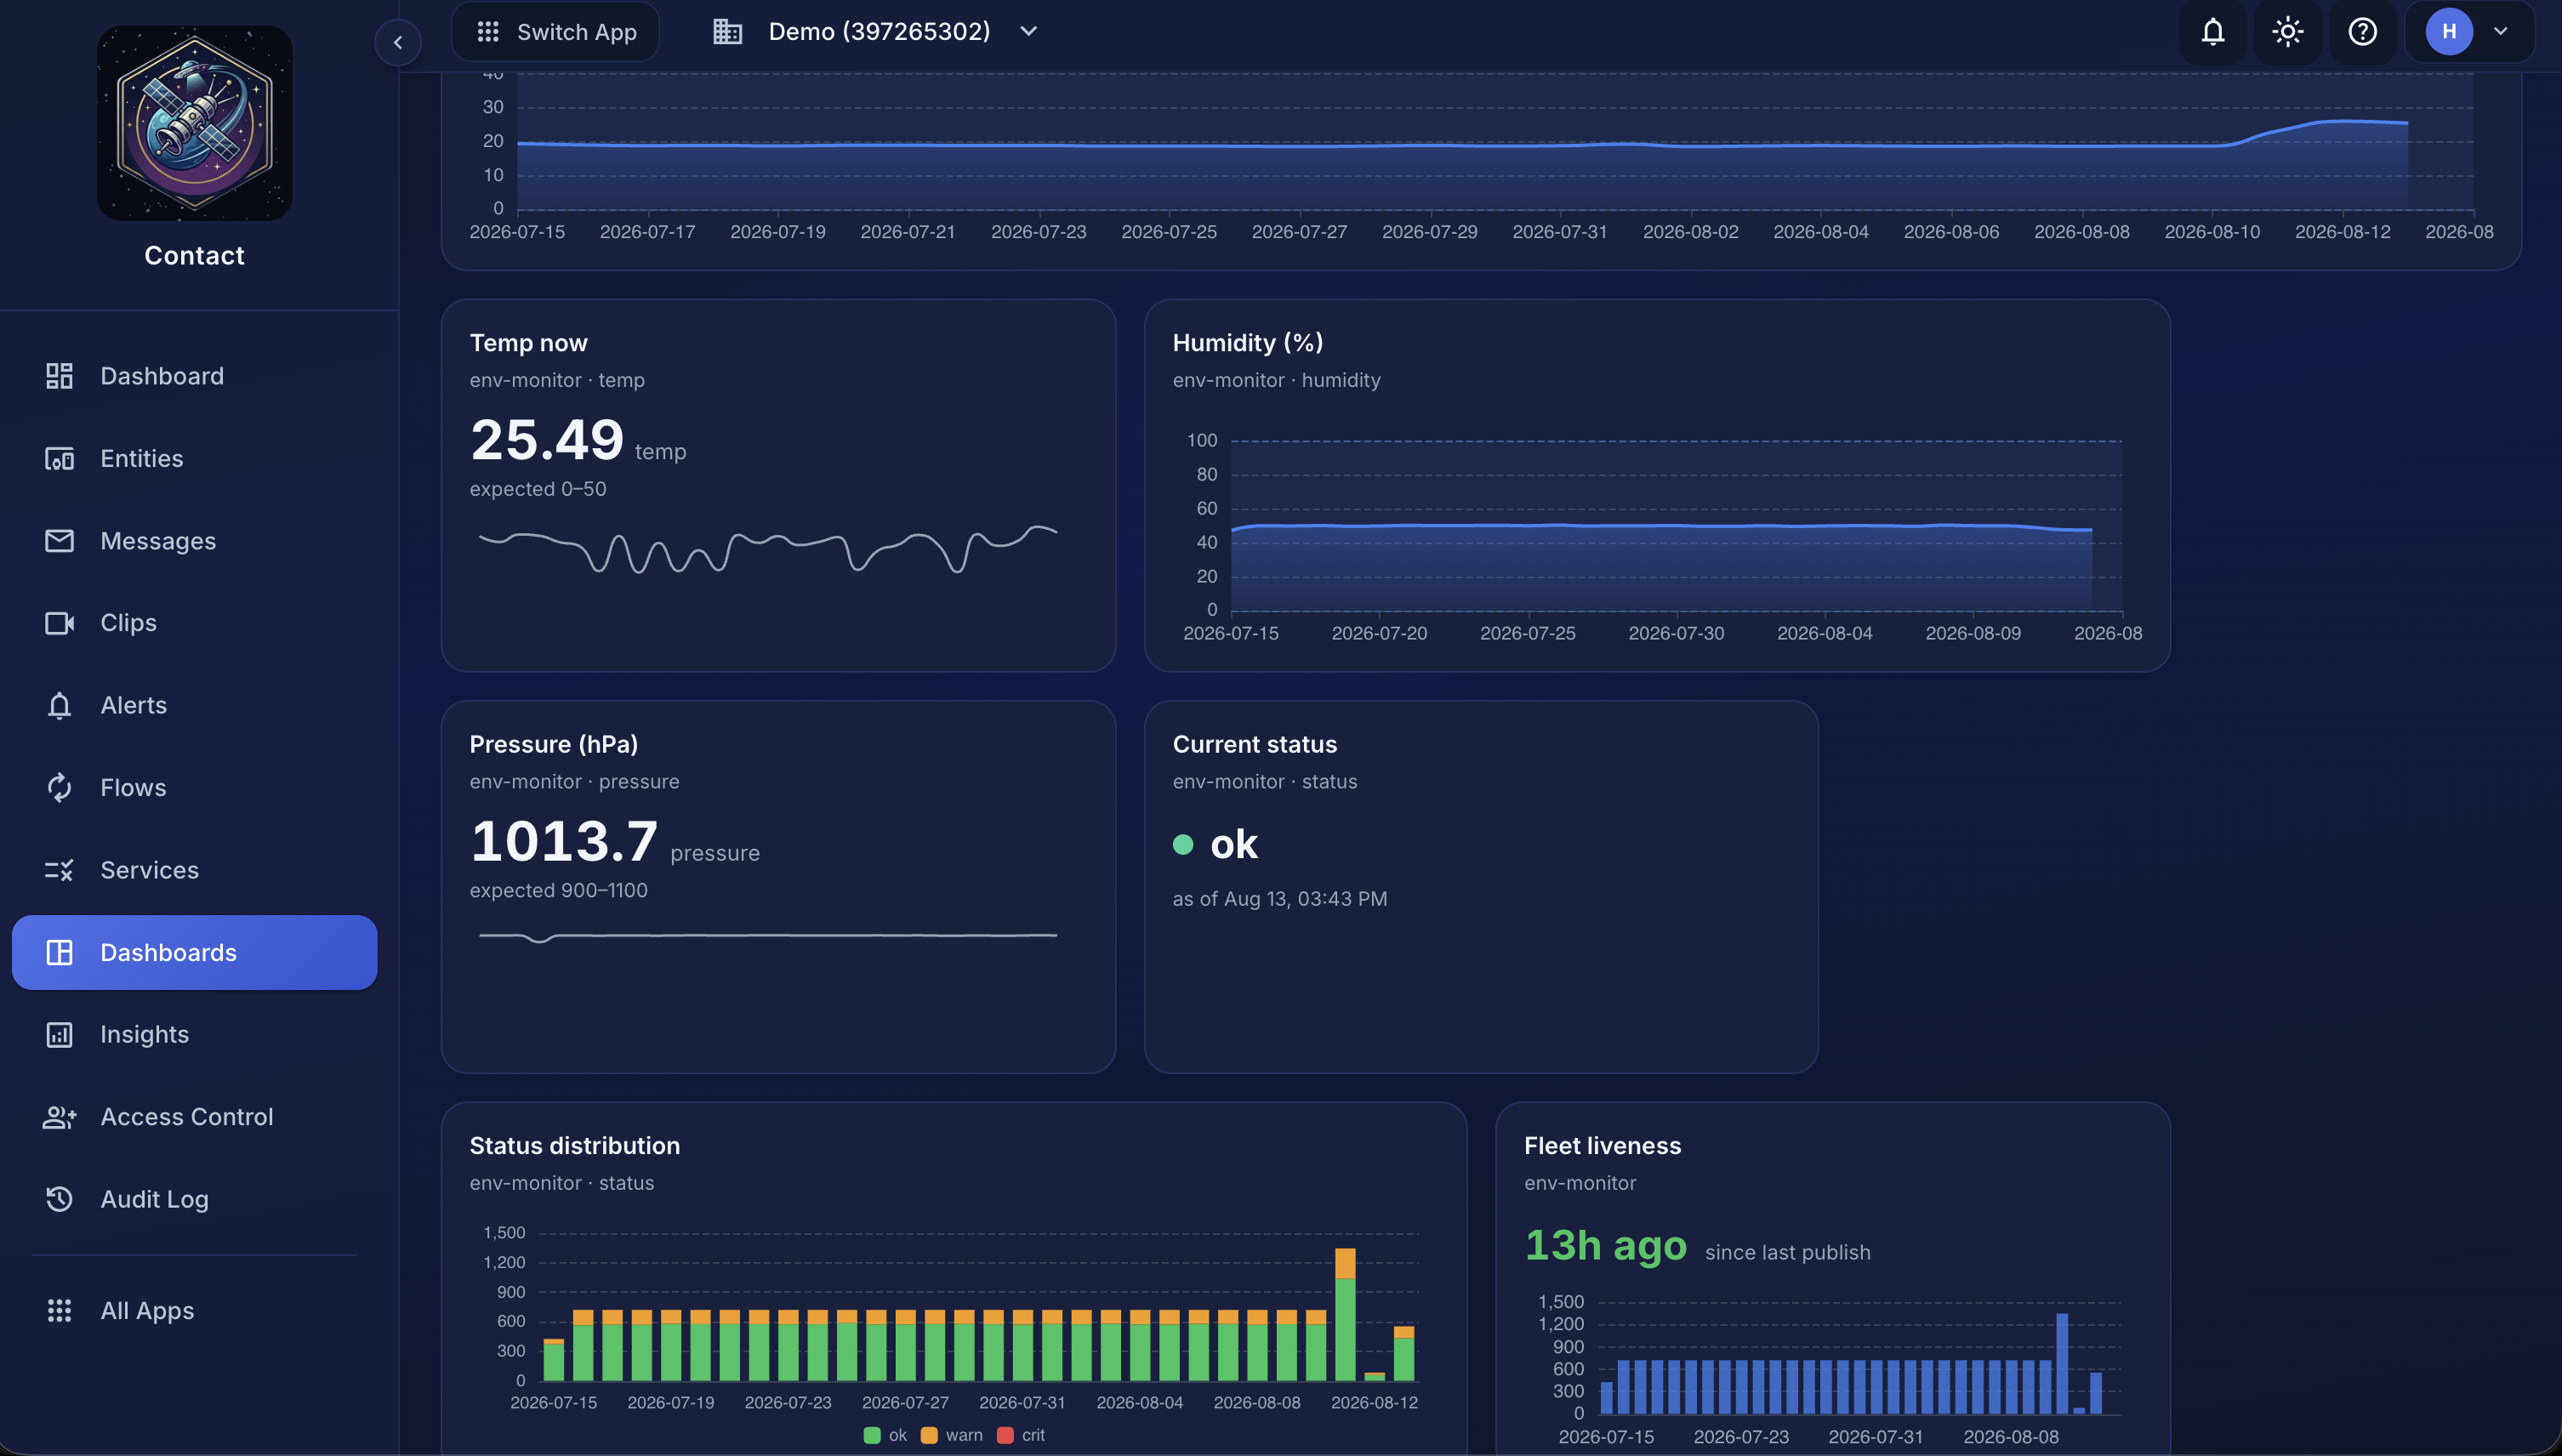
A Dashboard is a page of live widgets that chart the data your devices publish. There is no query language to learn: a widget binds to a service and a field, and Contact works out the rest from two sources. The service's validation rules say what a field should look like, and a sample of recent messages shows what devices actually send. Either way the builder knows the field's shape before you pick a chart.
Where the builder learns about your data#
| Source | What it contributes |
|---|---|
| Validation rules | the field's kind, an expected range (between, gt, lt), the allowed values (in, eq) |
| Recent messages | every field your devices published, an inferred kind, sample values, observed min and max |
| A path you type | any other field, charted as long as the data is numeric |
Rules make widgets smarter. A between [0, 50] rule renders as a shaded expected band on line charts and frames a gauge's scale; an in ["ok", "warn", "crit"] rule gives status tiles their states and keeps distribution and donut colors stable, with the first declared value green and the last red. A field with no rule still charts; it just has no band or severity colors until you add thresholds of your own.
Every service also offers two service-level widgets regardless of its rules:
- Validation health: the pass/fail trend of the service's validation, with the overall success rate.
- Message volume / liveness: publish rate over time and how long ago the service last heard from a device.
Any device can power a device health widget (memory and disk usage over time) fed by its heartbeats, and text and section header widgets need no data at all.
What a widget can be#
Thirteen widget types cover the usual dashboard vocabulary: line and bar charts, stat tiles, gauges, a fleet table with the newest value per device, donut and distribution charts of categorical values, current-status tiles, validation and liveness health, device health, text notes, and section headers.
On top of the type, each widget carries its own display settings: unit, decimals, thresholds that color a value from a given level upward, axis or gauge bounds, line versus area versus bar style, stacking, legend, color, and size (one to six columns wide, three heights).
Composing widgets#
- Several series on one chart: overlay another field, the same field for one specific device, or a field from a different service, each with its own label and color. On a fleet table, each extra series is a column.
- One line per device: split a single field into a series per device (the busiest twelve).
- Aggregations: average, minimum, maximum, sum, median, 95th percentile, standard deviation, last value, message count, count by value, and latest value per device.
- Compare to the previous period: charts draw the earlier window as a dashed twin; stat tiles show the change.
- Device selectors: declare a selector on the dashboard and point widgets at it. One dashboard then serves every device, chosen from a dropdown in the toolbar.
Time and refresh#
- The time-range picker applies to the whole dashboard and only offers ranges inside your plan's retention window. A custom range picks an exact start and end.
- Charts bucket automatically to keep a series readable at any range (roughly 60 to 200 points), and the toolbar shows which bucket is in use. A widget can pin its own bucket, or its own time range.
- Dashboards refresh automatically every 30 seconds while open; the interval is a dashboard setting. Full screen hides the app around the dashboard for a wall display.
Widgets stay stable when services change#
When you add a widget, it snapshots what it learned from the service: the inferred kind, expected range, and allowed values. Editing or deleting the service later never breaks a saved dashboard: the widget keeps rendering with its snapshot and shows a hint that its binding needs attention. Deleting a service is never blocked by dashboards that reference it.
Building with an AI assistant#
The same dashboards can be built by an assistant connected to the Contact MCP server. It has tools to discover what a service's devices publish, create and update dashboards, and run the widget queries directly for ad-hoc questions ("which device is hottest right now?"), plus a contact-dashboards skill that teaches it the conventions above.
Access#
Dashboards are shared account-wide. Who can do what follows IAM roles:
- Admin: create, edit, and delete dashboards.
- ReadOnly / FleetOperator: view dashboards and their live data.
- Device credentials cannot access dashboards.
See Building Dashboards for the step-by-step walkthrough.
